Buyers Have More Negotiation Power – Here’s How To Use ItYou may have heard there are more homes for sale right now. And while that’ll vary depending on the market, it

Dated: October 25 2022
Views: 103
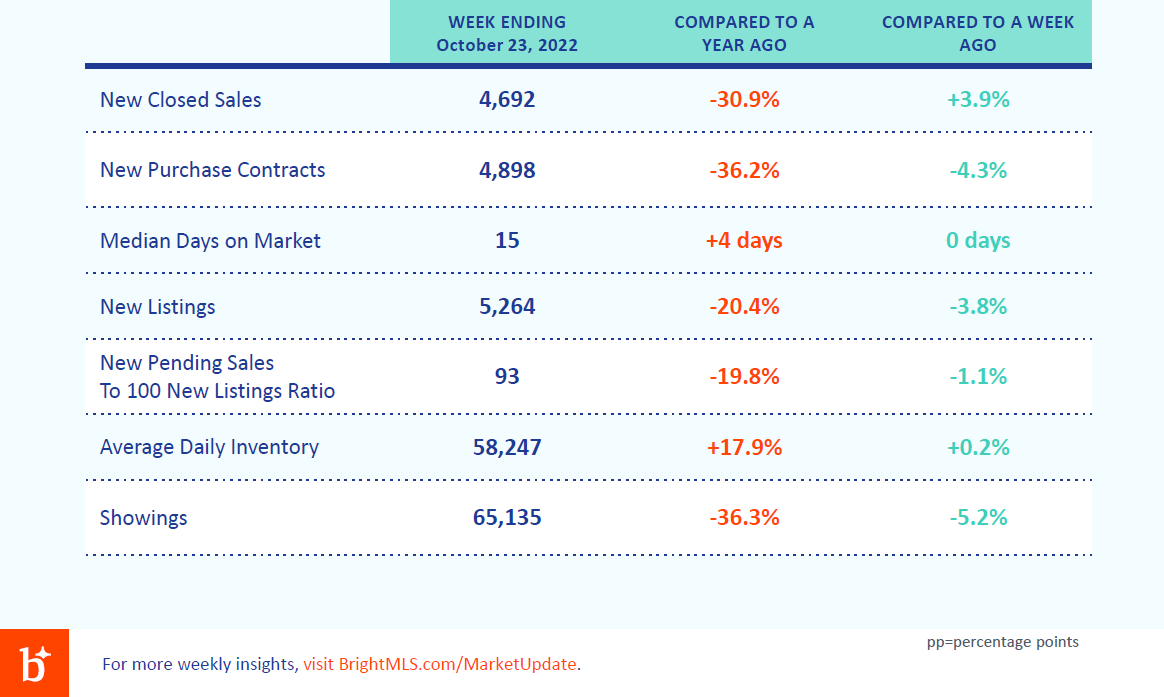
Access this weekly report for real-time data on residential market activity across the Bright footprint.

The Weekly Market Report provides up-to-date listing and showing information to help you track market activity in real time. These reports are posted to this page as they are released.
SUMMARY-REPORT |
FULL-REPORT |
Access previous Weekly Market Reports:
Register for your free SmartCharts account to view monthly housing statistics for your county. For an even deeper dive, upgrade to SmartCharts Pro and get more detailed information down to the ZIP Code or neighborhood level. Register today!

Andy is a graduate of Montgomery Blair High School (1969) in Silver Spring, Maryland, and graduated from Boston University (1974). He worked in legislation on Capital Hill, but soon after discovered h....
Buyers Have More Negotiation Power – Here’s How To Use ItYou may have heard there are more homes for sale right now. And while that’ll vary depending on the market, it
What’s Motivating More Buyers To Choose a Newly Built Home?Planning to buy a home soon? Why not go for something brand-new? Because data shows a lot more buyers are seeing the appeal of
Tysons Corner Center Undergoes Mall Makeover with New Eats and EntertainmentThe mall is welcoming in new places and saying goodbye to some of your favorite spots.By Michele Kettner
 © BRIGHT, All Rights Reserved
Information Deemed Reliable But Not Guaranteed
The data relating to real estate for sale on this website appears in part through the BRIGHT Internet Data Exchange program, a voluntary cooperative exchange of
property listing data between licensed real estate brokerage firms in which
participates, and is provided by BRIGHT through a licensing agreement.
The information provided by this website is for the personal,
non-commercial use of consumers and may not be used for any purpose other than to identify prospective properties consumers may be interested in purchasing.
Data last updated: September 24, 2026 12:18 AM UTC
Some properties which appear for sale on this website may no longer be available
because they are under contract, have Closed or are no longer being offered for sale.
Some real estate firms do not participate in IDX and their listings do not appear on this website. Some properties listed with participating firms do not appear on this website at the request of the seller.
Show More...
